You typed “design a SaaS dashboard” into your AI tool of choice. What came back was a wall of charts, three shades of blue that don’t match, and a retention percentage that somehow exceeded 100%.
Sound familiar?
The problem isn’t the AI. It’s the prompt. Most SaaS teams treat AI design tools like a magic wand — vague inputs, crossed fingers, and hope. But designing a dashboard that actually helps users make decisions requires structure, context, and specificity at the prompt level. Garbage in, garbage out — except here, the garbage looks suspiciously polished.
This guide gives you a practical framework for writing AI prompts that produce SaaS dashboard UI designs you can actually use, plus 20 copy-paste templates organized by screen type. Whether you’re using v0.dev, Figma AI, Claude, Midjourney, or Galileo AI — these templates work across tools.
What Makes a SaaS Dashboard Prompt Actually Work
Before you copy any template, understand why most prompts fail. It’s almost never about the tool. It’s about the four things every strong UI prompt must include:
1. Role — Tell the AI who it’s being. “You are a senior product designer specializing in B2B SaaS analytics interfaces.” This shifts the output from generic to opinionated.
2. Context — Define the user, the product, and the moment. “This dashboard is used by a Customer Success Manager during a weekly churn review.” Without context, AI defaults to showing everything. Context forces prioritization.
3. Constraint — Specify what should NOT be included. “Do not add decorative charts. Every visualization must map to a decision.” Constraints are the single most underused element in AI design prompts.
4. Output Format — Tell the AI exactly how to respond. “Output as React + Tailwind. Use shadcn/ui components. No inline styles.” Or for image-based tools: “High-fidelity mockup. Desktop viewport, 1440px wide. Light theme.”
Miss any one of these four elements and your output drifts.
The 4-Layer Prompt Framework for SaaS UI
Use the C.R.O.P. Framework every time you prompt for a dashboard component:
- C — Character: Who is the AI acting as? (Senior UX Designer, Frontend Engineer, Product Strategist)
- R — Reality: What is the real-world context? (User role, product type, business goal)
- O — Output: What format do you want? (React code, Figma-ready mockup, wireframe)
P — Parameters: What are the specific constraints, dimensions, components, and style tokens?
Example using C.R.O.P.:
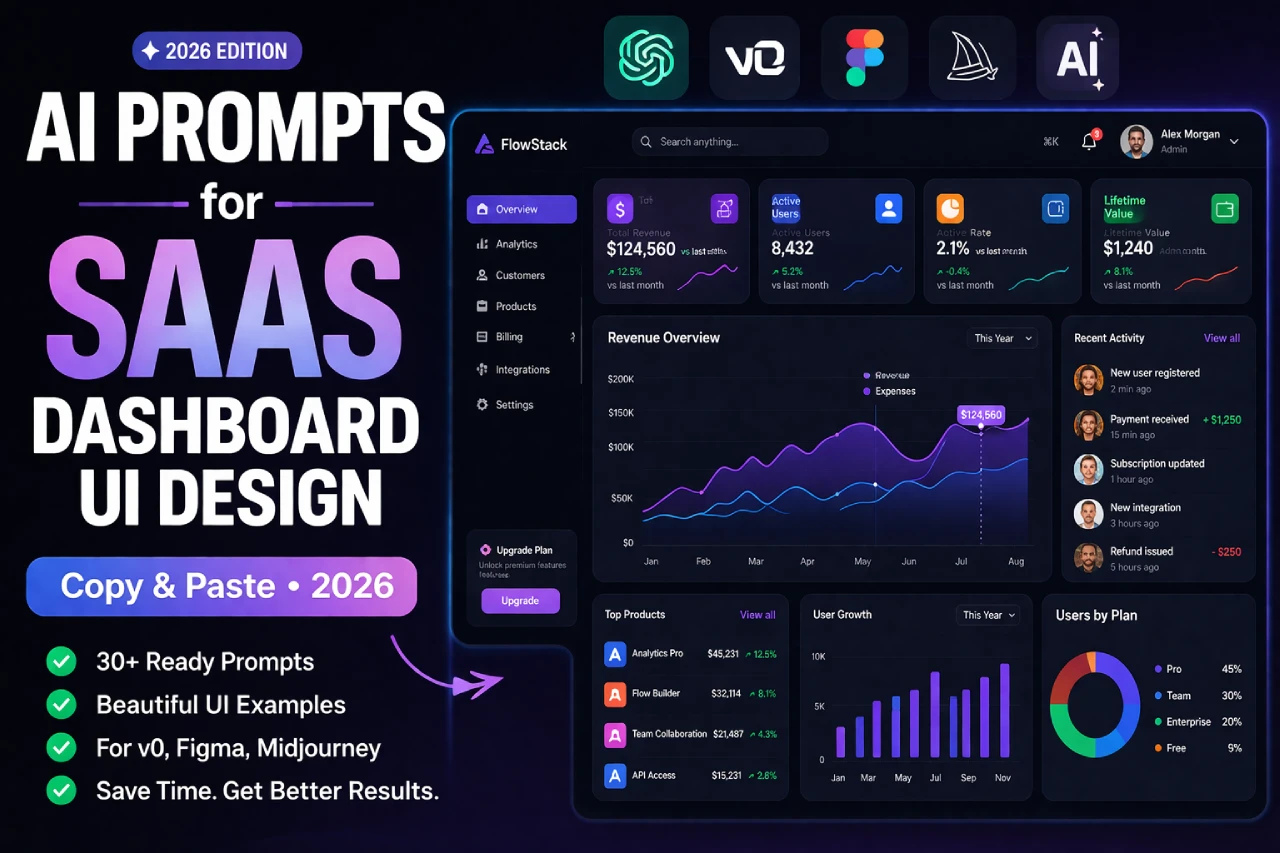
“[C] You are a senior B2B SaaS UI designer. [R] You’re designing the main analytics dashboard for a project management tool used by operations leads at mid-market companies. [O] Generate a high-fidelity desktop mockup at 1440px. [P] Include: top navigation bar with avatar and notifications, a 4-column KPI card row (tasks completed, overdue tasks, team velocity, burn rate), a full-width line chart showing sprint progress over 8 weeks, and a right sidebar with team activity feed. Light theme. Use Inter font, 8px border radius, neutral grays with a #6366F1 accent.”
That single prompt produces something usable. The four layers are what make it work.
AI Prompts by Dashboard Screen Type
This is the section you came for. Each prompt below follows the C.R.O.P. framework and is ready to use — paste, adjust the bracketed variables, and go.
KPI & Metrics Overview Screen
The metrics overview is the first thing users see. It needs to communicate status in under two seconds, with no analysis required.
MRR KPI Card ( Prompt 1 )
"Design a KPI card for a SaaS analytics dashboard. Label: 'Monthly Recurring Revenue'. Value: '$124,500'. Context badge: '+12.5% vs last month' in green (#10B981) with an up-arrow icon. Include a subtle sparkline filling the bottom 30% of the card. Style: white background, shadow-sm, rounded-xl, border-gray-100. Output: React + Tailwind CSS."
4-Column KPI Row ( Prompt 2 )
"Design a responsive 4-column KPI metrics row for a B2B SaaS dashboard. Cards: (1) Active Users — 8,432, +5.2%, (2) Churn Rate — 2.1%, -0.4%, (3) MRR — $94,200, +8.1%, (4) NPS Score — 67, +3pts. Each card has an icon (top left), value (bold, large), label (muted small text), and a trend badge. Light theme, consistent spacing. Output: React + Tailwind with shadcn/ui Card component."
Single Hero Metric with Drill-Down( Prompt 3 )
"Design a hero metric component for a SaaS executive dashboard. Primary metric: 'Annual Recurring Revenue — $2.4M'. Below it, show three supporting breakdowns in a mini 3-column grid: New ARR, Expansion ARR, Churned ARR. Use muted colors for supporting data, bold accent (#3B82F6) for the hero metric. Include a 'View full report →' link. No charts. Output: Figma-ready component description with spacing specs."
Real-Time Status Banner ( Prompt 4 )
"Design a real-time system status banner for the top of a SaaS ops dashboard. Show: API Uptime (99.98%, green dot), Active Jobs (1,204, neutral), Failed Jobs (3, red dot with pulse animation). Compact single-row layout. Dark theme. Use monospace font for numbers. Output: React + Tailwind, no external libraries."
Analytics & Data Visualization Screen
The biggest mistake here is adding charts because they look impressive. Every prompt should tie a chart to a decision.
Want to make your UI stand out with modern glowing effects? ✨
Check out these ready-to-use prompts:
👉 AI Prompts for Glowing UI Effects
Perfect for creating eye-catching dashboards, cards with glowing effect, and components.
Churn Analysis Chart ( Prompt 5 )
"Design a stacked bar chart component for a SaaS churn analysis dashboard. X-axis: last 6 months (Jan–Jun). Y-axis: churn count. Two stacked segments: Voluntary Churn (red, #EF4444) and Involuntary Churn (orange, #F97316). Include a legend below the chart. Add a plain-language insight above: 'Involuntary churn peaked in March — likely a payment failure spike.' Style: white card, recharts library. Output: React + Tailwind."
Revenue Trend Line Chart ( Prompt 6 )
"Design a multi-line chart showing MRR, New MRR, and Churned MRR over 12 months. Lines: MRR (blue, solid), New MRR (green, dashed), Churned MRR (red, dashed). Include interactive tooltips showing all three values on hover. X-axis: month labels. Y-axis: dollar values formatted as $Xk. No gridlines — use subtle dotted reference lines instead. Output: React using recharts. White card, 16px padding."
Cohort Retention Table ( Prompt 7 )
"Design a cohort retention heatmap table for a SaaS analytics dashboard. Rows: signup month (Jan–Jun). Columns: Month 0 through Month 6. Cell values: retention percentages. Color cells from white (0%) to #6366F1 (100%) using opacity steps. Show exact percentage values inside each cell. Include a sticky first column with cohort labels. Output: React + Tailwind. Optimized for readability on desktop."
Funnel Visualization ( Prompt 8 )
"Design a horizontal funnel chart for a SaaS conversion dashboard. Stages: Visitors → Trial Signups → Activated → Paid. Values: 10,000 / 2,400 / 1,100 / 380. Show absolute numbers and conversion rates between stages (e.g., 24% → Trial). Use descending width bars to convey funnel shape. Accent color: #8B5CF6. Output: SVG-based React component, no external chart libraries."
User Management / Admin Panel
Admin screens need density without confusion. Prompts here should specify exactly what actions are possible and what data is visible.
User Management Data Table ( Prompt 9 )
"Design a B2B admin panel data table for 'User Management'. Columns: Name (with avatar), Email, Role (badge), Last Active, Status (Active/Inactive toggle), Actions (Edit, Delete icons). Features: sortable column headers, checkbox row selection, bulk action bar appearing on selection, pagination (showing '1–25 of 847 users'). Zebra striping with gray-50 alternating rows. Sticky header. Output: React + Tailwind + shadcn/ui Table."
Role & Permissions Matrix ( Prompt 10 )
"Design a permissions matrix table for a SaaS admin settings page. Rows: user roles (Admin, Manager, Viewer, Billing Only). Columns: feature permissions (View Reports, Export Data, Manage Users, Billing Access, API Access). Cells: checkboxes or lock icons for restricted permissions. Color-code Admin row with a subtle blue background. Include a 'Save Changes' button in the top right. Output: React + Tailwind."
User Profile Drawer ( Prompt 11 )
"Design a right-side drawer component for viewing a user profile in a SaaS admin panel. Sections: Profile Info (avatar, name, email, role badge), Account Activity (last login, total sessions, plan), Danger Zone (Deactivate Account, Reset Password — red outlined buttons). Drawer width: 420px. Smooth slide-in transition. Include a close icon (X) top right. Output: React + Tailwind with shadcn/ui Sheet component."
Onboarding & Empty States
Empty states are where most SaaS products lose new users. These prompts help you design screens that guide rather than abandon.
First-Time Dashboard Empty State ( Prompt 12 )
"Design an empty state for a SaaS analytics dashboard seen by a new user who hasn't connected any data yet. Include: a centered illustration placeholder (describe as a dashed-border box, 200x160px), headline: 'Your dashboard is ready — let's fill it in', supporting text: 'Connect your first data source to start seeing metrics in real time.', primary CTA button: 'Connect Data Source', secondary text link: 'Import CSV instead'. Use friendly, non-technical copy. Light background, centered layout. Output: React + Tailwind."
Interactive Onboarding Checklist Widget ( Prompt 13 )
"Design a 'Getting Started' checklist widget for a SaaS dashboard sidebar. Show 5 setup tasks: Connect data source (✓ complete), Invite team members (✓ complete), Set up your first report (in progress, highlighted), Configure alerts (pending), Explore templates (pending). Progress bar at top showing 40%. Each task: checkbox, task name, optional 'Do this →' link. Collapsible widget with a header. Output: React + Tailwind."
No Results State (Filtered View) – Prompt 14
"Design a 'no results found' empty state for a SaaS data table after a user applies filters. Illustration placeholder (80px icon area). Headline: 'No results match your filters'. Supporting text: 'Try adjusting your date range or clearing some filters to see more data.' Two action buttons: 'Clear Filters' (primary) and 'Adjust Date Range' (secondary outlined). Centered in the table area. Output: React + Tailwind component."
Settings & Billing Screen
Settings pages are often neglected. These prompts help you design them with the same care as core product screens.
Billing Overview Screen ( Prompt 15 )
"Design a SaaS billing settings page. Sections: (1) Current Plan — 'Pro Plan, $149/month', with a 'Upgrade to Enterprise' CTA and plan feature list. (2) Payment Method — card ending in 4242, expiry 08/27, 'Update Card' button. (3) Billing History — table with Date, Description, Amount, Status (Paid/Failed), Download Invoice icon. Use clean card-based layout. No clutter. Output: React + Tailwind + shadcn/ui."
Notification Preferences Panel ( Prompt 16 )
"Design a notification preferences settings panel for a SaaS product. Group notifications by category: Product Updates, Usage Alerts, Billing, Team Activity. For each: a toggle switch (on/off), label, and one-line description. Add a channel selector (Email / Slack / In-App) per category using segmented buttons. 'Save Preferences' sticky at the bottom. Output: React + Tailwind."
Team & Workspace Settings ( Prompt 17 )
"Design a 'Team Settings' page for a B2B SaaS product. Sections: Workspace Name (editable input with inline save), Workspace Logo (upload zone), Team Members table (avatar, name, email, role dropdown, Remove button), Invite Members section (email input + role selector + Send Invite button). Danger Zone at the bottom: 'Delete Workspace' in red. Output: React + Tailwind + shadcn/ui."
Navigation & Layout Structure
Getting layout right at the prompt level saves enormous iteration time later.
Sidebar Navigation ( Prompt 18 )
"Design a collapsible sidebar navigation for a B2B SaaS dashboard. Expanded width: 240px. Collapsed width: 60px (icons only). Nav items: Dashboard, Analytics, Reports, Users, Integrations, Settings. Active state: filled background, accent color #6366F1. Icons: outlined, 20px. Include workspace switcher at top (logo + name + chevron) and user profile menu at bottom (avatar + name + logout). Output: React + Tailwind."
Top Navigation Bar ( Prompt 19 )
"Design a top navigation bar for a SaaS analytics platform. Left: product logo + current workspace name. Center: global search bar with keyboard shortcut hint (⌘K). Right: notification bell (with badge count), Help icon, user avatar with dropdown (Profile, Settings, Log Out). Height: 64px. Border-bottom: 1px solid gray-100. Background: white. Sticky positioning. Output: React + Tailwind + shadcn/ui."
Dashboard Shell Layout ( Prompt 20 )
"Design the full shell layout for a SaaS analytics dashboard. Structure: fixed left sidebar (240px), fixed top bar (64px), scrollable main content area, optional right panel (320px, toggled). Main content area should have 24px padding, max-width 1280px, centered. Include a breadcrumb row below the top bar. Account for sidebar collapsed state (60px). Output: React layout components using Tailwind. No placeholder content needed."
Prompt Chaining — Building a Full Dashboard Flow
Single prompts are useful. Chained prompts are how you build a consistent product.
The idea is simple: each prompt builds on the output of the previous one, sharing a design system reference. Here’s a 5-step chain for a complete SaaS analytics dashboard:
- Step 1 — Define the design system “Define a design system for a B2B SaaS analytics dashboard. Output a JSON token object with: primary color (#6366F1), neutral grays (50–900), border radius (8px default), font (Inter), spacing scale (4px base), shadow levels (sm, md, lg). I’ll reference this in all subsequent prompts.”
- Step 2 — Build the shell “Using the design system defined above, create the dashboard shell with fixed sidebar (240px), top nav (64px), and scrollable content area.”
- Step 3 — Add the metrics layer “Using the same design system and shell, add a 4-column KPI card row below the page header. Cards: Active Users, MRR, Churn Rate, NPS. Each card follows the established spacing and border-radius tokens.”
- Step 4 — Add charts “Add a 2-column chart section below the KPI row. Left (66% width): 12-month MRR trend line chart. Right (33% width): Churn breakdown donut chart. Use the same card component established in Step 3.”
- Step 5 — Add the activity feed “Add a right sidebar panel (320px) showing a team activity feed. Recent events list: avatar, user name, action description, timestamp. Match the visual style from the existing shell. This panel should be dismissible.”
Each step anchors to the system defined in Step 1. The result is a UI that looks like one product, not a Frankenstein stitched from five different sessions.
Best AI Tools to Use These Prompts With
Not every tool handles every prompt type equally. Here’s a quick reference:
- v0.dev (by Vercel) — Best for React + Tailwind code output. Handles component-level prompts extremely well. Use prompts 1–17 here for production-ready code.
- Figma AI / First Draft — Best for high-fidelity mockups inside an existing Figma project. Strong for layout and shell prompts (18–20). Less reliable for complex data visualizations.
- Claude (claude.ai) — Best for structured, multi-step prompt chaining and when you need the AI to reason about UX decisions before generating. Use the full C.R.O.P. framework and chain approach here.
- Midjourney / DALL-E — Best for visual mood and inspiration. Not suitable for production UI. Use for early-stage design direction, not component-level output.
- Galileo AI — Strong for full-screen mockup generation from natural language. Good for quickly exploring layout variations before moving into code.
- Cursor / GitHub Copilot — Best when you already have a codebase and want to generate components that match your existing patterns. Feed it your existing component code as context before prompting.
Common Prompt Mistakes SaaS Teams Make
Vague adjectives instead of specifications “Make it modern” tells the AI nothing. “Use 8px border radius, Inter font, neutral-100 backgrounds, and #6366F1 as the only accent color” tells it everything.
No user context Prompts without a defined user persona produce dashboards designed for no one. Always specify who is looking at this screen and what decision they need to make.
Requesting everything at once “Design the entire dashboard” is a recipe for visual chaos. Break prompts into components and use chaining to maintain consistency.
Ignoring output format Forgetting to specify React vs. image vs. wireframe leads to mismatched outputs. Always end your prompt with the exact format you need.Skipping constraints The most overlooked line in any prompt is what to not include. Without constraints, AI fills space. With constraints, it focuses.
Frequently Asked Questions
Use prompt chaining with a shared design token reference. Start every session by defining your design system (colors, typography, spacing, border radius) and reference it in every subsequent prompt. This is the most reliable way to avoid the “Frankenstein UI” problem.
Yes, but with some adaptation. For Figma, remove the “Output: React + Tailwind” instruction and replace it with “Output: Describe this as a Figma Auto Layout component with padding, fill, and spacing specifications.” Tools like Figma AI and Builder.io’s AI can also consume structured prompts to generate Figma-compatible output.
Yes, with minor adjustments. Replace width-based layout instructions (e.g., “4-column grid”) with mobile-friendly alternatives (“2-column grid, stacked on mobile”). Add “Responsive. Mobile breakpoint at 375px.” to your Parameters layer. Sidebar navigation prompts should be adapted to bottom tab bars or drawer menus for mobile.